Dashboard
Card Not Present › Merchant Backoffice › Dashboard
Your real-time transaction overview — six months of activity at a glance
The Dashboard is the first page shown after login. It gives you a graphical summary of transaction activity for the past six months. Navigate to it at any time by clicking Dashboard in the left-hand menu.
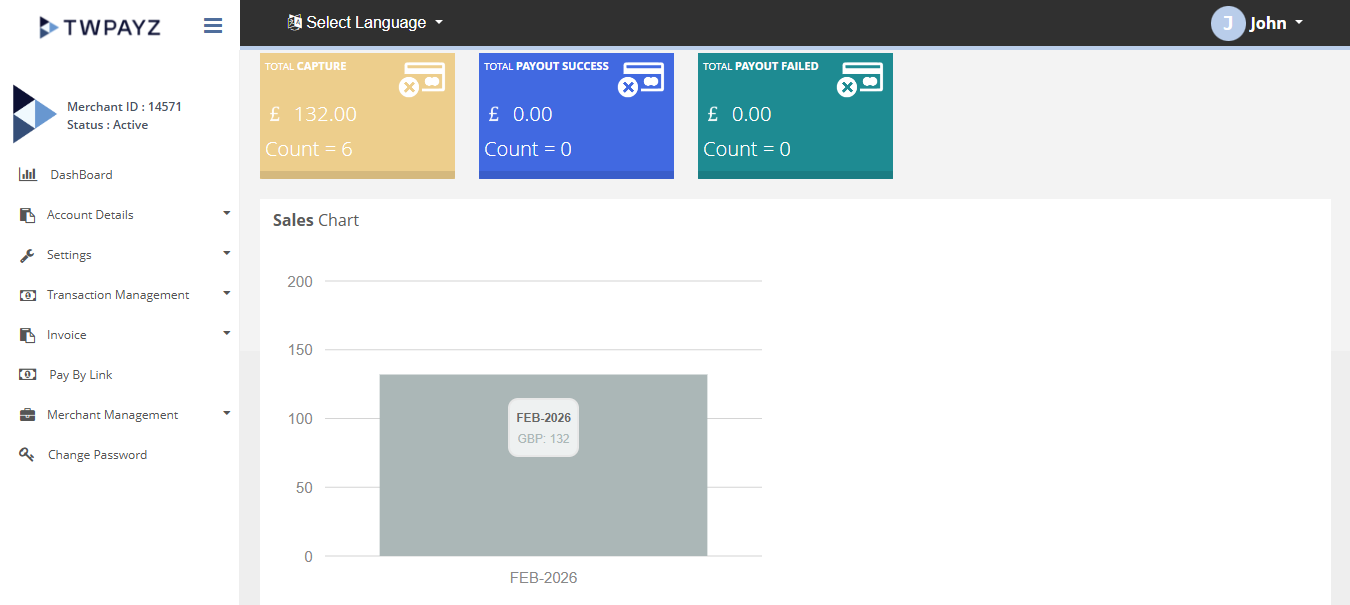
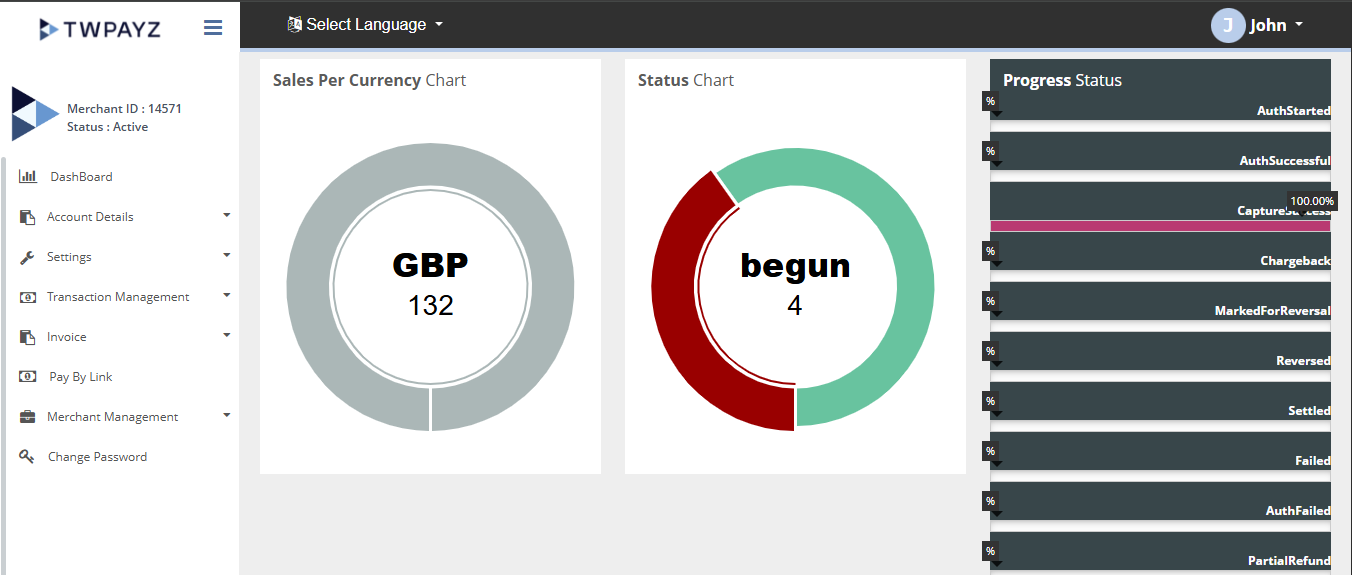
Dashboard Components
| Component | What it shows | How to use it |
|---|---|---|
| Sales chart | Bar chart of transaction volumes by month over the past 6 months | Identify peak trading months at a glance. Hover over bars to see exact figures. |
| Sales per currency chart | Breakdown of transaction volume split by currency (GBP, EUR, USD, etc.) | Useful if you process in multiple currencies — shows your currency mix. |
| Status chart | Pie/donut chart showing proportion of Approved, Declined, and Pending transactions | A high decline rate may indicate fraud attempts or a technical issue — investigate if the Declined slice is unusually large. |
| Progress status | Running count and value totals for the current period | Quick view of how many transactions have been processed so far today/this month. |
| eCommerce transactions | Metrics specific to card-not-present (online, Pay by Link, invoice, Virtual Terminal) transactions | Track your CNP channel performance separately from card-present. |
| POS transactions | Metrics for card-present (terminal) transactions | Only relevant if you also have a card machine. Shows terminal activity alongside your CNP. |
Change the date range: use the date range selector at the top-right of the dashboard to adjust the period. All charts and metrics update simultaneously.